
Nikita Vasilyev: Future of Web Tooling

Firebug was initially written in 2006, and since then, it has transformed the way we create web pages. Before Firebug, debugging consisted mainly of inserting alert statements. Now we have an interactive console, breakpoints, DOM inspector, and live CSS editing. It seems a lot comparing to nothing, yet I think it’s only an inception.
My talk will shed light on how primitive our current tools are and how we can improve them. In addition, I’ll introduce new tools such as WebKit Timelapse, and share other tools used in different industries (like Game Development and VFX). I’ll highlight what we, web developers, can learn from them.

- » Russia, Moscow
- » Website
- » Github
- » Google+
Transcript
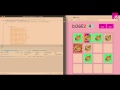
Hey! So, change the title a little bit, Pimp up your workflow. How do we get to understand how programs work? One way is to read the code, top to bottom, read all the files. Execute it in your head. Keep the stack in mind. Well, it might work for small projects. When you have something big, it would take a while. Say, imagine you have a project. With hundreds of files. And hundred thousands of lines of Js code. Are you going to read all of it before you start to work on a feature or fix a bug? How do you start? The project is so big. You don't know which file you would need. One way of understanding how a program works is console statements everywhere. So, you open, find some function. Put some console .Log statements. You open the browser. See what is in the console. If it is not what you expect it, you do the same over again. Another way is to use the debugger. And insert breakpoints. Breakpoints are great. Because you can insert them without the page. You can disable them too. But one problem with breakpoints is that they block. Imagine you are debugging. And you have 2 function competing. When you step on a breakpoint it blocks the execution. Breakpoints are not the best tool for that kind of task. So, today I'm going to be showing a few other tools. That I believe not so popular. And I think they're great for understanding how programs run and how they work. And they actually allow you to see actual states of the program. So, the first one is lighttable. One cool feature I like is inline Watchers. When we read the code we don't really know what's inside the variable. And lighttable allows to watch, to select some code and start watching it. It will show the value in realtime. As the program ran. So, I'm going to run some demo. On the rightside there is a demo. Processing library in Javascript. On the leftside the code. I see the variables but I don't know what it is. What is Other? Is it a number? Undefined on first click. And some object on the second click. You can see, Lighttable is updating in realtime. Here is some velocity property. I don't know what it is. It is a vector. And it updates in realtime as you play around in your code. There is some drag property. I don't know what it is. So, what was it... Watch expression. Another cool tool is inline eval. So, it works like this. You select some code and press command enter. It should the last. Right in the code. Not in a console. But right there. So, those were 2 features of Lighttable that I really like. If you don't use Lighttable, maybe you should check it out. If you work on some tools, maybe you should implement some of those features in your favourite tool. Timeline is available in Chrome tools. Firefox dev tools. When people talk about Timeline they talk about profiling, measurements zhozer i'm going to use it different. So, here is a demo. It is the same webpage. To record the events. I want to know, I want to find the function responsible for mouse down events. Or click. I don't know where it is. I don't know how many files I have. I can see all the timers. All the mouse events. There are too many. I filter down to mouse. From there I can jump right to the function that was executed on mousedown. I didn't read any code before that. So, this is a good tool to give you an overview of how your program works. When you see a program for the first time. You don't know where to start. You can play around and see what gets executed. But, and from there you can jump to the files and functions that you want to edit. So, another tool is Adobe Brakets Theseus. It is actually an extention to Adobe Braket. Which is a... I am going to play another demo. I have a game. It is just a webpage in Javascript. And in the editor you can see there are 21 calls, 24 calls. So, it is logging all the function calls that are happening on the webpage. You can see what is running at this time. You can see which functions are not used. And which ones are used. And you can narrow it down. You can see all the function names and the arguments. They are all there. You don't need to insert hundreds of console.Logs. From there you can see that from keyboard input manager all those callbacks were called. You can see call stack. You can go up. Okay. That was adobe brakets theseus. Another tool is in the webstore. It is an ID. It has a feature Spyjs. It is similar to Braket theseus. But it has slightly different user interface. I'm going to show you. Where am I? Hm... Maybe not. Maybe I'm not going to show you. Okay. Ignore that. It logs all events on the left column. I speed it up a little bit. It highlights in light green background the pieces of code that ran. There is a conditional here. It didn't run. Because it doesn't have a background. You can see which parts got executed. There are a lot of events there. The same as Adobe Brakets you can see argument values. That was SpyJs. So, I think it is all cool. What would be better I think. What if I just could play it back? So, oops. Okay. So, about 1,5 years ago I was playing around with one tool. Called it Rewind. I do some Dom operations. And what if I played it back? And forward. And forward. And so I was working on a tool that captures all the Dom manipulations. Allows to rewind them. Eventually I realised it is not practical. I only captured Dom. Not Js events. Input. If there is something going on in an interval. And tries to access the dom. And I rewind it. It will try to do something with an element that is no longer there. So. I kept it as a project. Hopefully, fortunately... Some other tool. Tools out here. So, this is Timeline again in Web Inspector. I have a hidden feature. Web replay. At this stage it doesn't do that much. But you'll see. So, I basically played it back as it was. It captured all the values such as random. And information. And played exactly the same as it was. For now, wouldn't it be amazing rewind back. Play some code. Loop some animation and tweak around with values and just play. And you don't need to hit refresh all the time. So, this was a current implementation in the webkit nightly. I'd like to finish with a video. Isn't it amazing. I hope at some point you'll be able to rewind back and play it again. And change some value. We hit refresh all day long. And I think it is not necessary. Timelapse is now called Webreplay. And it doesn't allow you to rewind as I showed you. I hope will get there eventually. I hope, Web replay will change the way we develop web apps. Thank you. (applause) Edit transcript via pull request.